
Charts and Dashboards
Dashboards are usually used to display Key Performance Indicators (KPIs). The difference between a Chart and a Dashboard is that a Dashboard is made up of different Charts displaying various types of information that you may need to view.
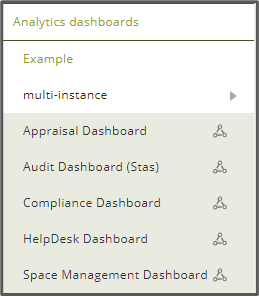
This is the main menu in MAC with all the previously created Dashboards that you have created, or that people have shared with you under Analytics dashboards. You can only view other people’s dashboards when they have been shared with you.
Creating a Dashboard
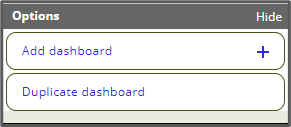
To create a new Dashboard, you click Add Dashboard.
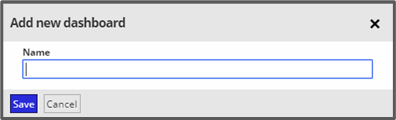
The popup below then appears so you can then type the name you want to call the new Dashboard and click save.
You can now drag and drop the Charts you would like to have on your Dashboard. You can resize them by dragging the bottom right corner.
Here are all the different types of Charts that can be added to your Dashboard and these can all be customised. You will only be able to see certain types of Charts depending if you have that module or not.
There are currently five different types of Chart:
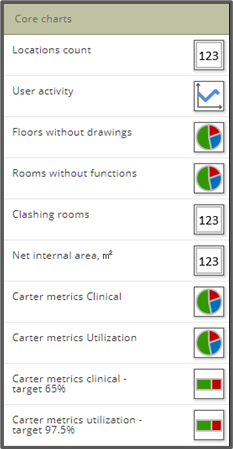
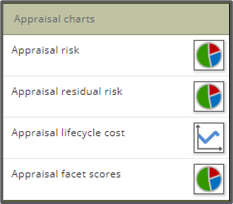
Core Charts Appraisal Charts
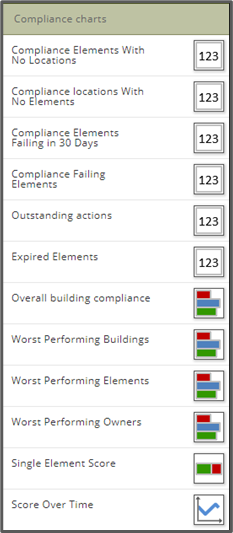
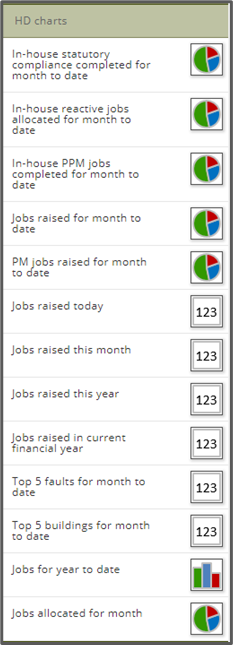
Compliance Charts Helpdesk Charts
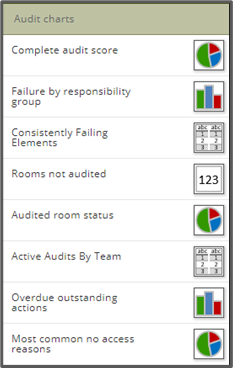
Audit Charts
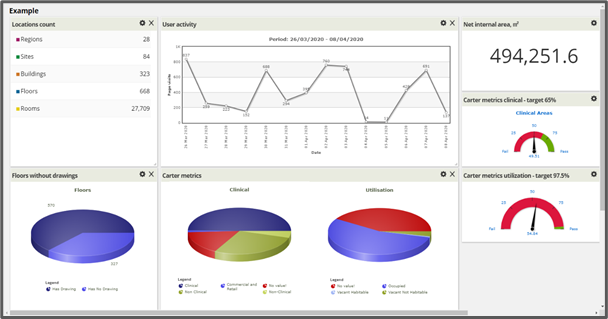
This is an example of some of the Charts that can be added to the Dashboard. These can be dragged and dropped to where you want on the dashboard.
To edit a chart click Configure, this will allow you to change different aspects of the Chart.
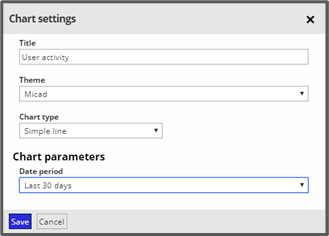
If you click on the cog icon in the corner of the Chart, you can change parameters or click ‘X’ to delete the chart.
Clicking on the cog icon gives you this menu so you can change parameters like the chart name, theme, chart type and for this chart date period. The parameters vary depending on the chart type.
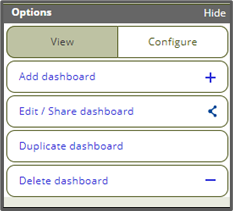
With the configure options you can also Add Dashboard, Edit / Share Dashboard, Duplicate Dashboard or Delete Dashboard.
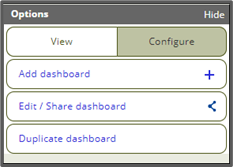
The View options are the same except you cannot delete a Dashboard.
Edit/Share Dashboard – Change the Name of the dashboard and sharing options.
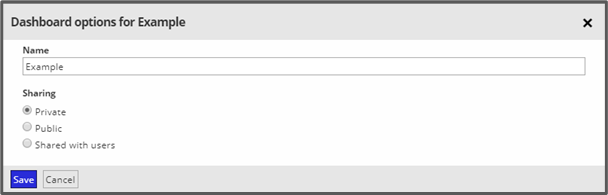
The above screenshot shows the sharing options which if ‘Private’ only you can view, ‘Public’ everyone on the system can see or ‘Shared with users’ you can add people names you want to see the dashboard and they will get a link to the dashboard.
Duplicate Dashboard – Create a copy of the current Dashboard.
You might want to create a duplicate dashboard if you wanted to compare data for different floors or different buildings and you would just change the location in the parameters (Cog Icon).
Delete Dashboard – Deletes current Dashboard.
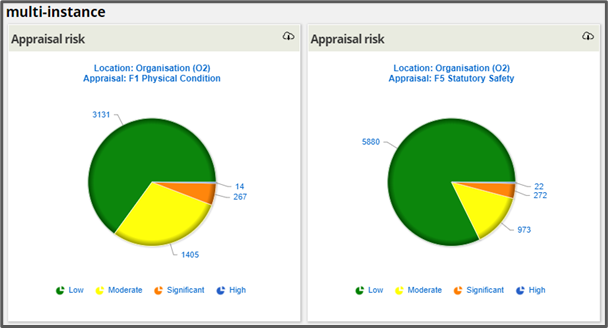
Multi-instance Charts
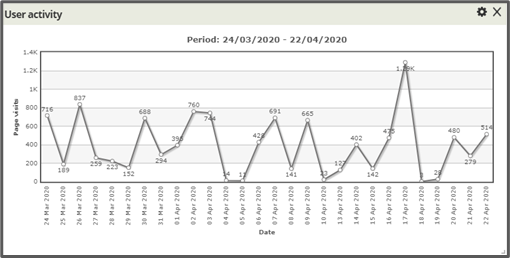
The below screenshot shows that you can have multi-instances of the same Chart on one dashboard, but you can have each one showing different data.
In the top right corner of this chart type, there is a download icon which allows you to download the data that is used to create the chart in CSV format.
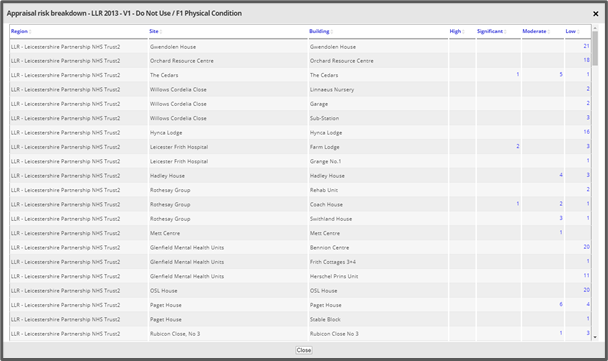
If you click on the chart this information is also displayed with the breakdown of the data and if you click on the clickable links it will show more specific information.
Comments
0 comments
Please sign in to leave a comment.